The April update of Business Analyst Web App is here! This update brings several enhancements including the new options for using competitive layers in Suitability Analysis, more streamlined experience with ArcGIS Online for finding and adding ArcGIS content, and improvements for the Build Infographics and New Comparison Reports workflows.
Here are the highlights:
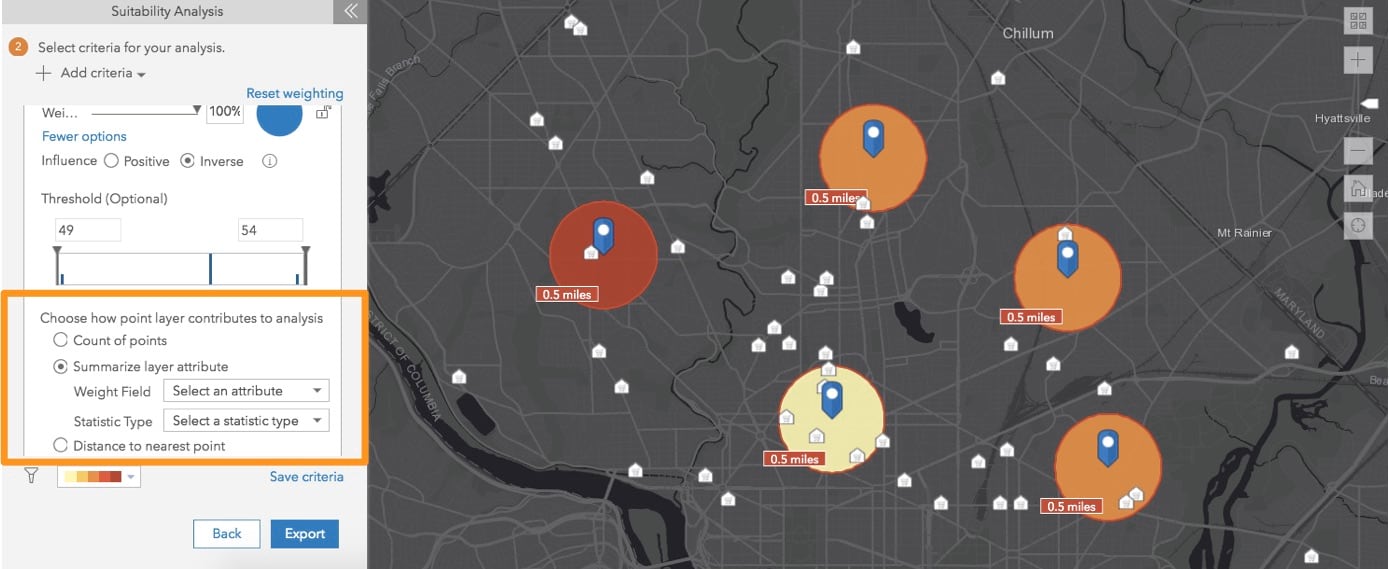
Use New Options for Competitor Locations in Suitability Analysis
Optimize suitability analysis with improved competitive landscape input around your sites. Select from these options when choosing how the competitor layer contributes to the analysis:
- Count of points allows you to use the number of competitors that fall within your sites.
- Summarize layer attribute allows you to choose any attribute from the point layer e.g. use the sum of the sales volume values of all the competitors that fall within your sites.
- Distance to nearest point allows you to use the distance of the nearest competitor from your site.
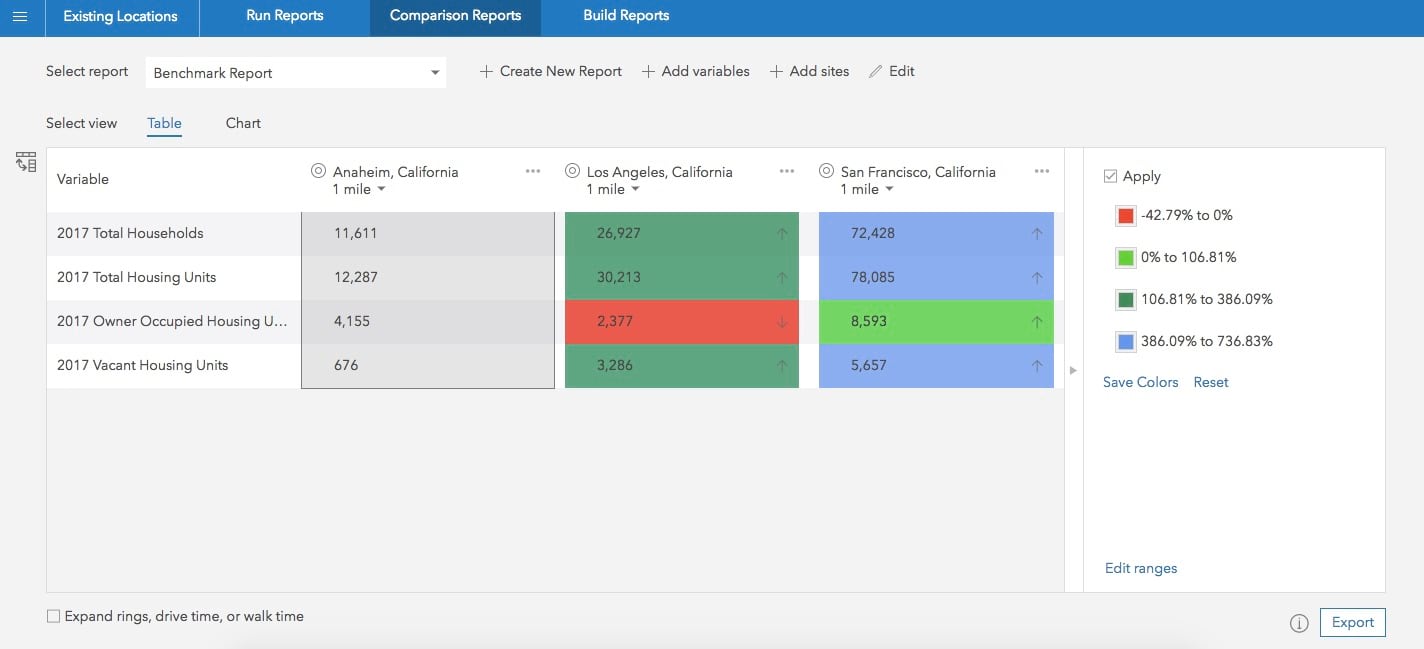
Compare Locations Visually and Interactively
Create and organize custom comparison reports more easily. Use a good performing location as a benchmark to evaluate other locations against it. Create multi-variable charts and more informative visualizations in just a few clicks. Learn more.
Add ArcGIS Content More Efficiently
Easily find and add content from ArcGIS Online including the maps and layers you own, from groups, organization, and Living Atlas, as well as publicly available. Use various filtering, sorting, and search options and get a content browsing experience consistent with what it is in ArcGIS Online. Learn more.
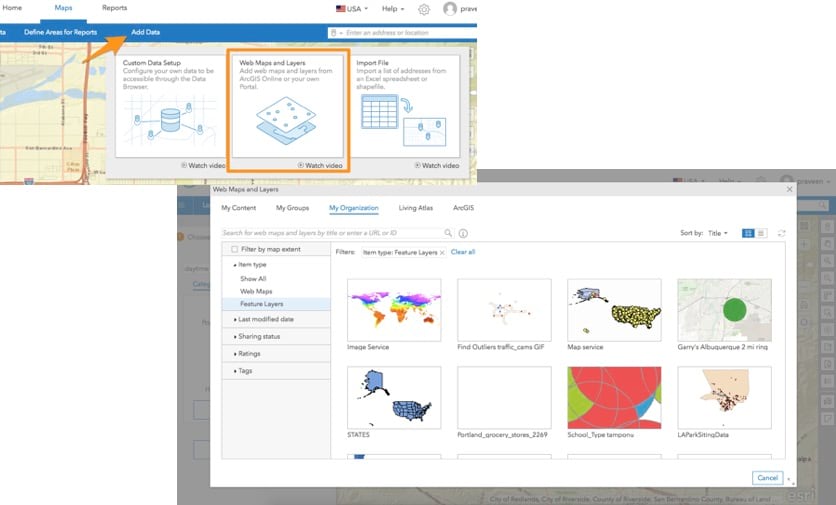
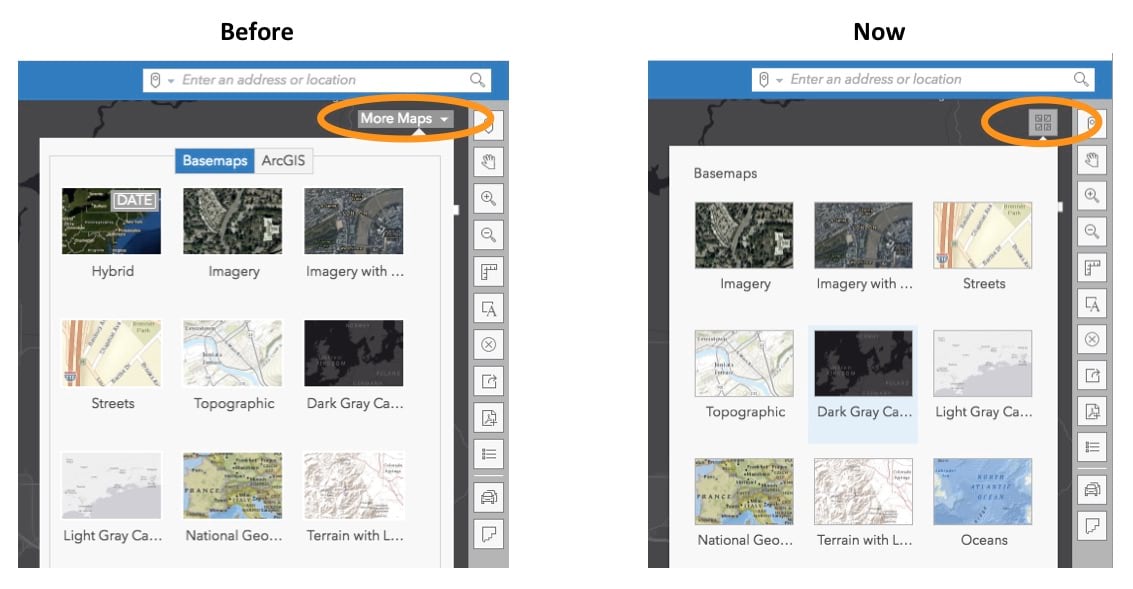
You will also notice that the More Maps button is replaced by a Basemaps icon to provide an easier way for changing basemaps. The experience of adding data from ArcGIS Online will continue to be available from the Add Data menu along with other options for bringing data in the BA Web App.
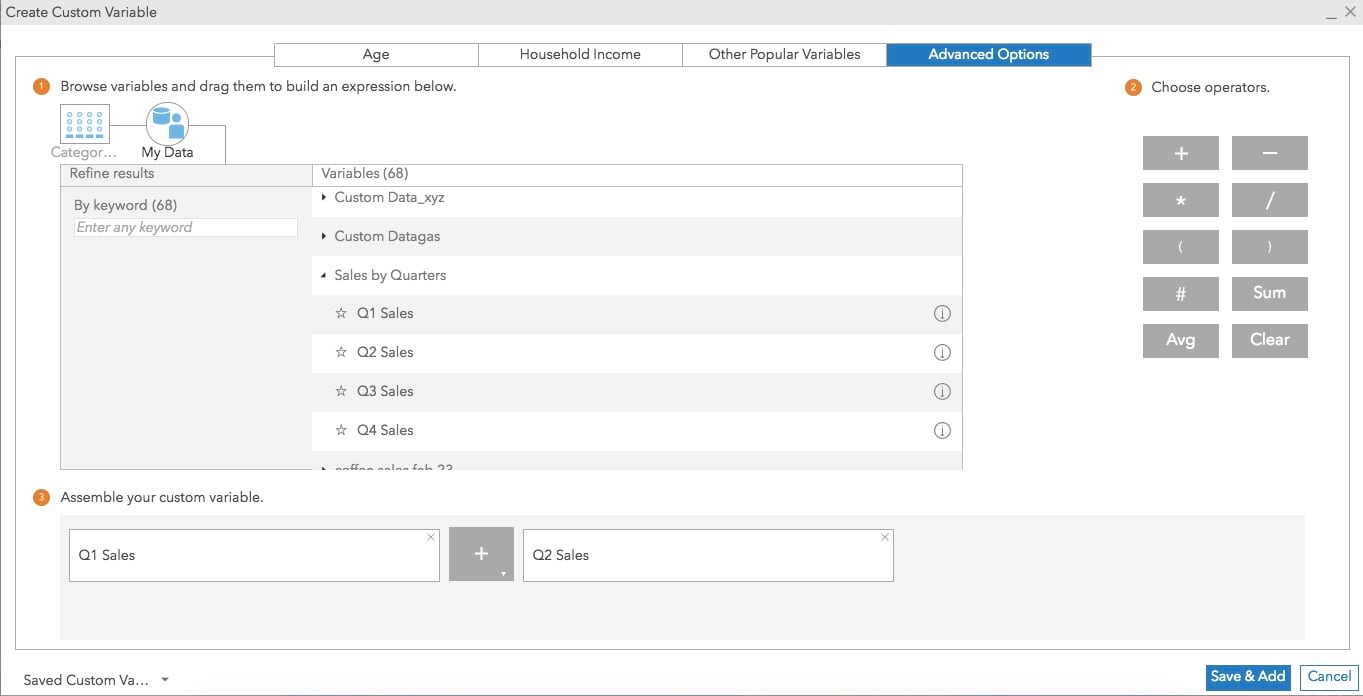
Create Custom Variables from Your Own Data
Calculate derived variables from your own data variables which are brought in using the Custom Data Setup workflow. For example, let’s say you have quarterly sales variables (e.g. Q1 sales, Q2 sales) added in BA Web as custom data. You will be able to create a custom variable by adding Q1 and Q2 sales to determine the sales for the first half of the year or by subtracting Q2 sales from Q1 to determine quarterly sales change.
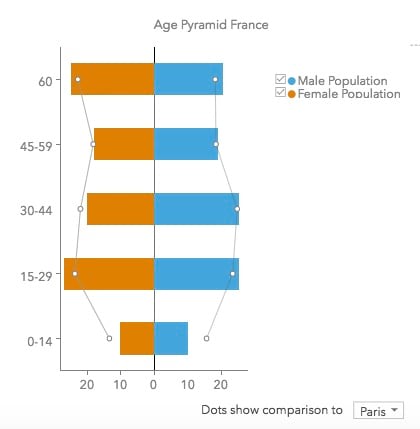
Use More Customization Options in Infographics
- Create custom age pyramids. For example, use the Population by Age distribution variables for France and create an age pyramid to understand male and female population distribution by age in one view.
- Create charts using negative values. For example, easily visualize demand and supply using positive and negative values respectively for them.
- Use text attributes from your own data in reports and infographics. For example, include the text-based parcel land use information in custom reports and infographics and put it together with numerical data (e.g. demographics) aggregated for your sites.
- Set up minimum and maximum range values for gauge charts
- Export and save drill-down panels as images
Global Data Updates
This release includes data updates for several countries:
- Michael-Bauer Research data update to 2017 vintage for Western European countries including Belgium, Denmark, France, Germany, Netherlands, Spain, UK, and more and to 2016 vintage for Oceania, Caribbean, North Africa, and Sub-Sahara African countries.
- Germany—The Advanced dataset from Nexiga was updated to include four additional data variables: Total Births, Total Deceased, Total Male Population, and Total Female Population.
- Japan—The Advanced dataset from Esri Japan was updated to include 2015 Census and Income and 2016 Spending and Savings data and more.
Learn more on the Esri Demographics page.
Coming soon..
- Ability to use infographic templates in your custom applications using the ArcGIS API for JavaScript. The rich experience of using infographics as beautiful, visual, and interactive data summary in the BA Web App will be available to embed in your custom applications.
- Enhanced Business Analyst Mobile App with a better user experience and support for German, French, and Brazilian-Portuguese languages.
Login and start using the latest Business Analyst Web App today.


Commenting is not enabled for this article.