On December 16th, 2019 NASA’s Terra satellite flew over the eastern coast of Australia, capturing 3D data on the height of smoke plumes emanating from the fires with its Multi-angle Imaging SpectroRadiometer (MISR) instrument. Using data from this overpass, the NASA Disasters Program in collaboration with the Active Aerosol Plume-height (AAP) project has developed the first ever interactive 3D visualization of MISR fire plume-height data, which demonstrates the new 3D capabilities of the NASA Disasters Mapping Portal.
View Fullscreen on the NASA Disasters Mapping Portal
 The above interactive map allows you to view and explore this MISR smoke plume data in 3D. You can click on the images at the bottom to view the data from several pre-selected angles. These data show that in some areas the smoke plumes reached heights of more than 4 kilometers above the surface at the time of this satellite overpass.
The plume heights are represented as spheres with progressively lighter colors for higher elevation, and the height has been visually exaggerated by 20x to better see the details in the data. The same data is also shown on the ground in 2D, with darker blues and purples indicating lower altitude plumes and lighter greens and yellows indicating higher altitudes. The color bar to the right shows the derived plume heights corresponding to the colors in the 2D data. In addition, “hot spot” data from Terra’s MODerate resolution Imaging Spectroradiometer (MODIS) instrument is shown as red spheres on the ground, indicating areas of active fires. The base layer of natural-color imagery is from MISR's nadir-viewing camera.
This Earth-observing satellite data provides researchers and disaster management agencies with the “big picture” of the location and intensity of fires in the region, and gives an idea of where the smoke is being transported. The data can also be used to initialize air-quality and chemical transport models. In particular, plume elevation data from MISR can greatly improve the accuracy with which models can predict where the smoke will go, and what regions may be affected downwind. NASA is assisting the Australian Bureau of Meteorology (BOM) to improve air quality forecasts for the fires using Earth-observing data, and the NASA Disasters Program is studying short and long-term impacts and risks from the fires associated with air quality, aviation, wildlife and ecosystems, and climate dynamics.
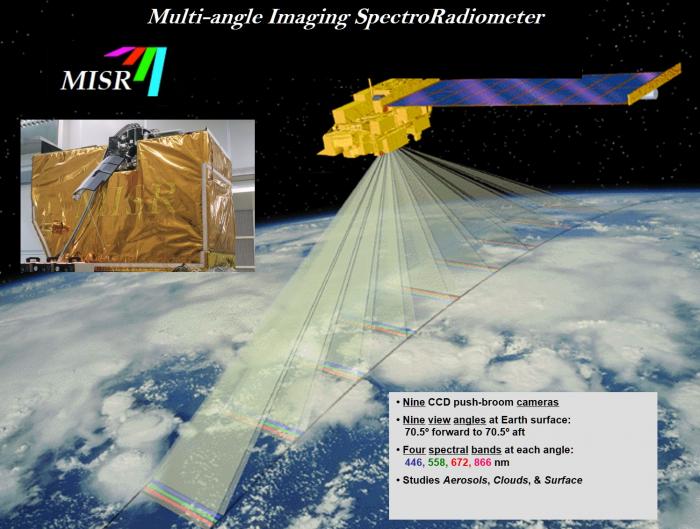
This diagram illustrates how the 9 cameras of the MISR instrument onboard NASA’s Terra satellite view Earth, and also shows the spectral bands in which they observe. Credit: NASA
MISR detects the height of a cloud or smoke plume above Earth’s surface by viewing it from space at different angles. A plume located high above the surface will appear to move considerably relative to the underlying surface when view at different angles, whereas a plume closer to the surface will appear to shift less. MISR contains nine cameras that image Earth at a wide range of angles, allowing us to observe the apparent shift (called parallax) of smoke plumes from the wildfires in Australia, and to use this to determine the height.
Related Impact


